株式会社ピー・アール・オー iPhone Android スマートフォンアプリ
アプリ補足
GraphDiary 補足説明:ひとつのグラフに複数の折れ線グラフを表示する方法
GraphDiary appendix : How to display several polygonal lines on one line graph
[関連] GraphDiary紹介ページ
[1]
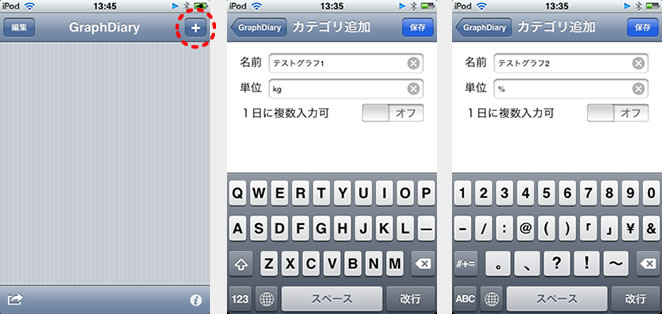
GraphDiary起動後、ヘッダー部右の「+」ボタンをタップして2つ以上のグラフカテゴリを追加します。
※本説明では「テストグラフ1」、「テストグラフ2」のカテゴリを追加したと見なします。
You can tap "+" icon on the top-right screen to add more than 2 graph categories. sample explanation means that you added 2 categories called "Test Graph 1" and "Test Graph 2".
[2]
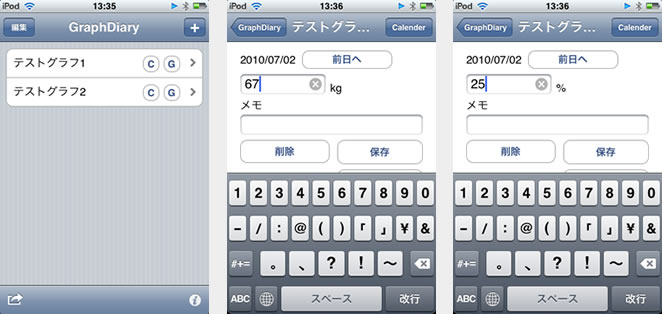
グラフカテゴリを追加後、「テストグラフ1」、「テストグラフ2」に適当な数値を数日分入力します。
数値を入力後、ヘッダー部中央に「GraphDiary」と表示されているアプリトップ画面に戻ります。
You can enter a few days' desired values at input boxes of "Test Graph 1" and "Test Graph 2".
After that, you can return to application's home screen displayed "Graph Diary" on header.
[3]
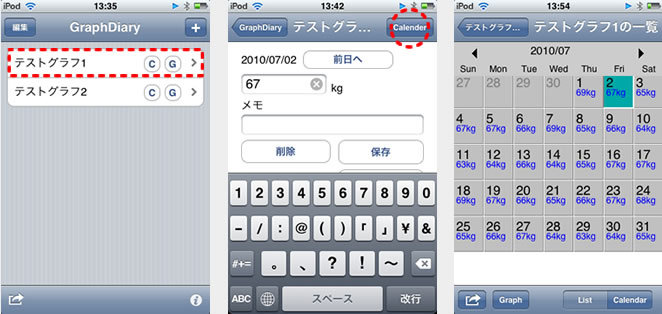
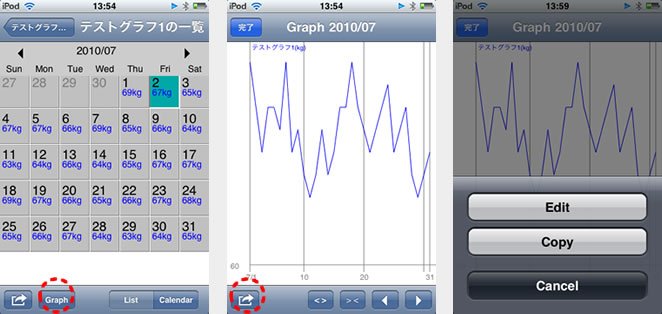
アプリトップ画面から「テストグラフ1」のカテゴリをタップし、データ入力画面上の「Calendar」ボタンからカレンダー画面を表示してください。
You would tap on "Test Graph 1", and "Calendar" button on next screen to see the calendar of "Test Graph 1".
[4]
カレンダー画面フッター部「Graph」ボタンをタップすると、「テストグラフ1」カテゴリ単体のグラフが表示されます。
グラフ画面のフッター部左のアイコン「ポップアップ」ボタン(長方形枠内から右矢印が表示されているアイコン)をタップしてください。
「Edit」、「Copy」、「Cancel」の3つのボタンがポップアップ表示されます。
You can see the line graph of "Test Graph 1" after you tapped "Graph" button on the bottom-left screen.
Three buttons, "Edit", "Copy" and "Cancel", will appear after you tapped icon called "Pop-up" icon on the bottom-left screen.
[5]
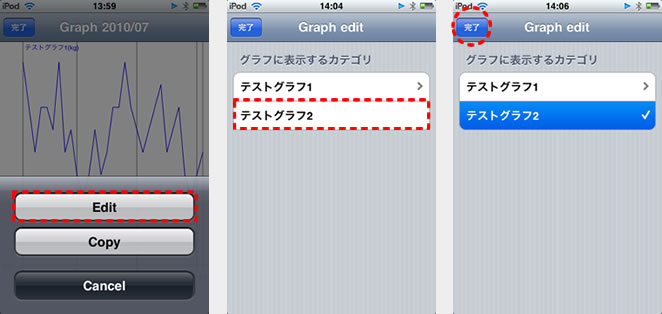
「Edit」ボタンをタップすると「テストグラフ1」のグラフ編集画面が表示されます。
この画面では「テストグラフ1」と同時に表示させるグラフカテゴリの選択を行います。
今回は「テストグラフ2」のカテゴリをタップしチェックマークをつけてください。
ヘッダー部左の「完了」ボタンをタップしてグラフ編集画面を終了します。
If you tapped "Edit" botton, you could see "Graph edit" mode's screen.
You would see 2 categories "Test Graph 1" and "Test Graph 2" on your screen.
You can tap on "Test Graph 2" to put a checkmark on it. Then you would tap "Done" button on the top-left screen.
[6]
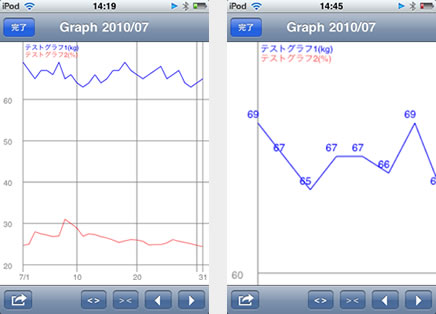
「テストグラフ1」のグラフ画面に「テストグラフ2」のグラフが追加表示されます。グラフは2つ以上表示可能です。
グラフ画面はダブルタップやピンチでズームイン/アウトが出来ます。
Two polygonal lines will appear on your line graph. A polygonal line of "Test Graph 2" has added on the screen of "Test Graph 1".
You can display more than 2 polygonal lines on one line graph.
The line graph is possible to zoom in by 'double-tapping' and 'pinching'.